
##The solution of these questions are provided in the exercise of week12 lecture.Week 12 Exercises: Quarto document
1 Setting up
At https://ondemand.osc.edu, start a new RStudio session (Starting an RStudio Server session at OSC).
Switch to your RStudio Project (Working directory and RStudio Projects)
Create a new directory
week12in your home directory using functiondir.create("week12")Open a new
Quarto filein RStudio:File->New File->Quarto Documentsand save the file asw12_exercises.qmd(insideweek12directory). You will write your answers to the questions below in this Quarto file
2 Exercise
2.1 YAML header
Save your Quarto (.qmd) file that contains your script in HTML format.
Add the following key–value pairs to the YAML header of your Quarto document:
- Author name
- Date
- Table of contents
- Create nested format options in the YAML header using
format:html:and set thetheme to cyborg.
2.2 Code Chunks
Install the
palmerpenguinspackage in the Console, and load the package in a code chunk of your Quarto document. Save the penguins dataset in an object calledpenguin_data.Open the second code chunk, select the columns
flipper_length_mm,island,yearand save them asnew_penguinsobject. Add a code chunk option to hide the code in the rendered file.Use
penguin_datato create a scatter plot with theggplot2package oftidyverse. Setflipper_length_mmas the x-axis andbody_mass_gas the y-axis. Refer to theggplot2documentation to understand the syntax of scatter plot. We will discussggplotinWeek 13.Customize your figure by:
- Adding a figure caption
- Changing the figure dimensions (height and width)
- Aligning the figure to the center using chunk options
Render your document, download the output, and verify that it includes the scatter plot.
If document does not contain scatter plot, add the appropriate option in the YAML header to include figures in the HTML output.
Render the document again and confirm that the scatter plot is now included.
2.3 Text
Add headers of different levels above your code chunks.
Write a short text section describing the scatter plot you created in question 9.
3 Solutions
3.1 YAML header
1-3. YAML header
3.2 Code chunks
4. install palmerpenguins package and save object
library(palmerpenguins)
Attaching package: 'palmerpenguins'The following objects are masked from 'package:datasets':
penguins, penguins_rawpenguin_data <- penguins5. Select columns
## First load tidyverse to use select function
library(tidyverse)
── Attaching core tidyverse packages ──────────────────────── tidyverse 2.0.0 ──
✔ dplyr 1.1.4 ✔ readr 2.1.5
✔ forcats 1.0.0 ✔ stringr 1.5.2
✔ ggplot2 3.5.2 ✔ tibble 3.3.0
✔ lubridate 1.9.4 ✔ tidyr 1.3.1
✔ purrr 1.1.0
── Conflicts ────────────────────────────────────────── tidyverse_conflicts() ──
✖ dplyr::filter() masks stats::filter()
✖ dplyr::lag() masks stats::lag()
ℹ Use the conflicted package (<http://conflicted.r-lib.org/>) to force all conflicts to become errorsnew_penguins <- penguin_data |>
select( flipper_length_mm, island , year)6. Scatter plot
library(ggplot2)
penguin_data |>
  ggplot(aes(flipper_length_mm, body_mass_g)) +
  geom_point()
Warning: Removed 2 rows containing missing values or values outside the scale range
(`geom_point()`).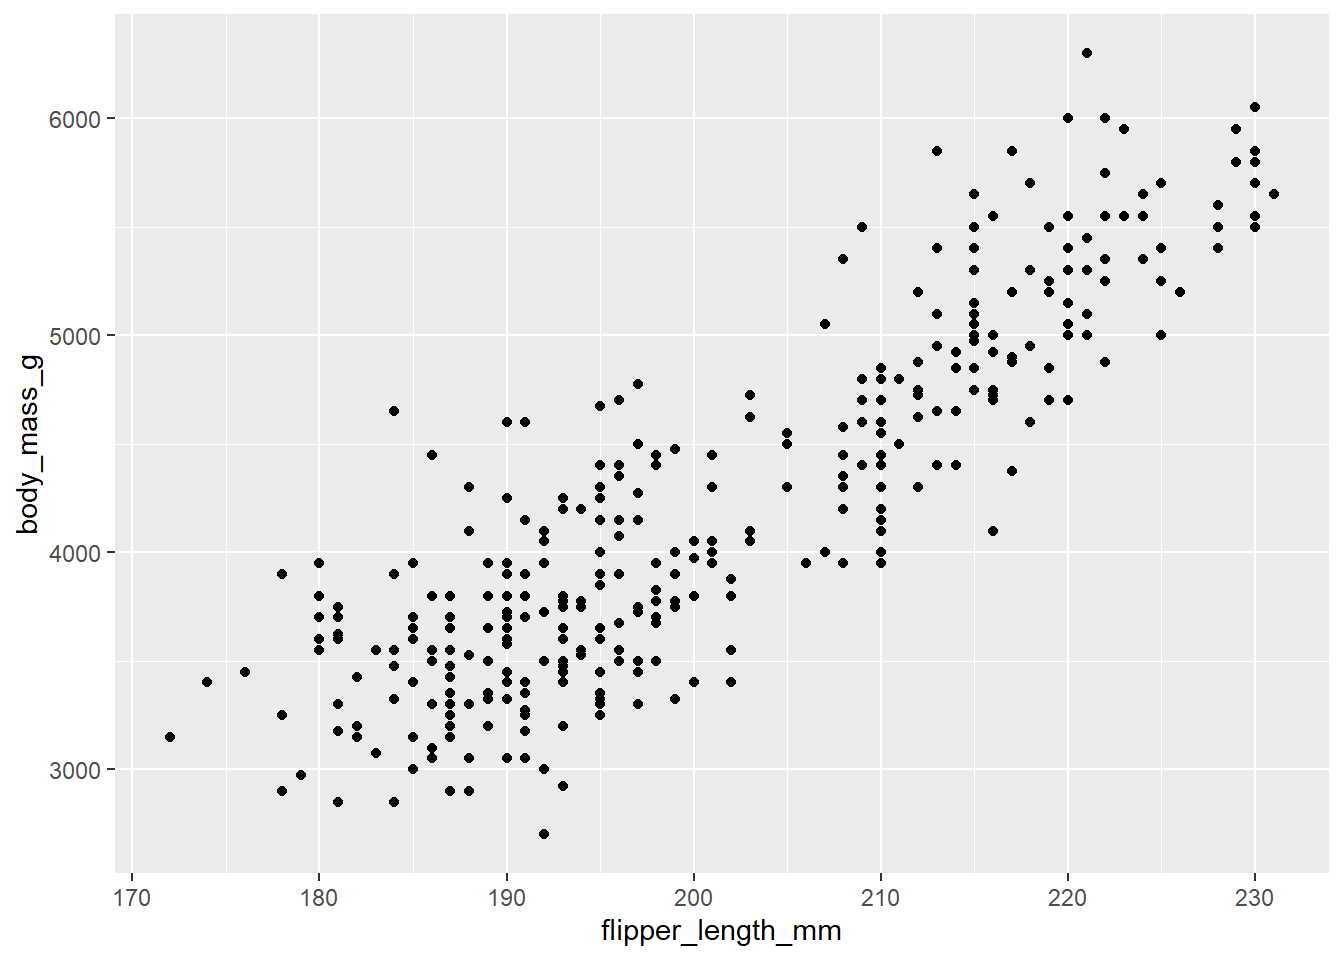
7. Customize your plot
```{r}
#| fig-cap: "Scatter plot of palmerpenguins datasets"
#| fig-width: 5
#| fig-height: 4
#| fig-align: center
penguin_data |>
  ggplot(aes(flipper_length_mm, body_mass_g)) +
  geom_point()
```
Warning: Removed 2 rows containing missing values or values outside the scale range
(`geom_point()`).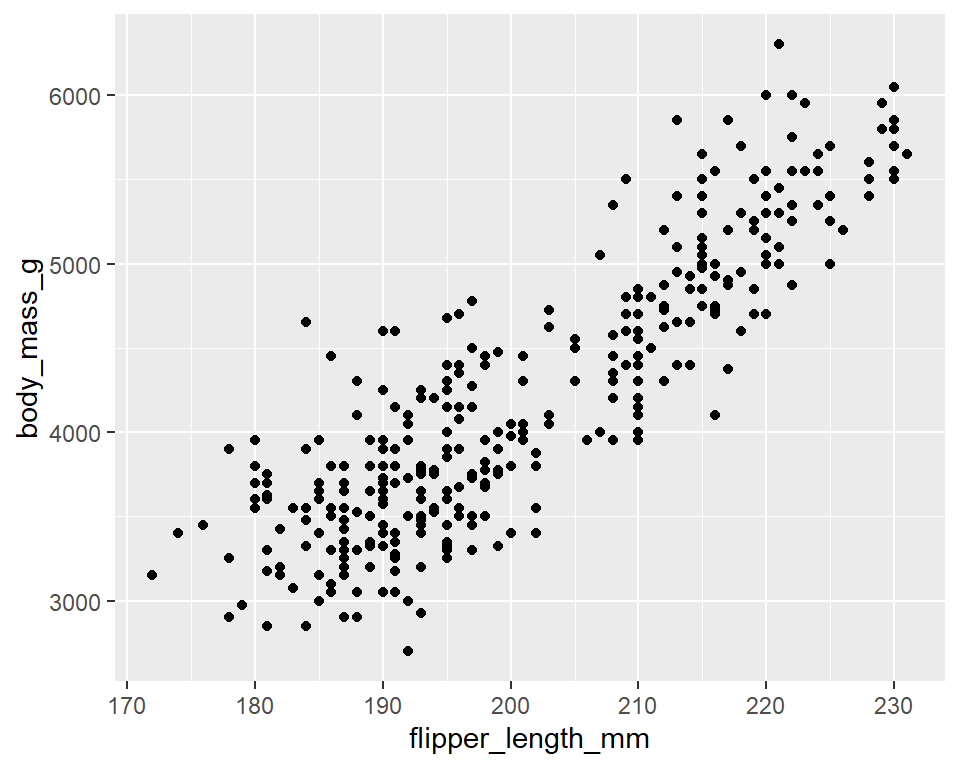
8. Include your plot in HTML
embed-resources: true in your YAML header to make your document self-contained