Sequence file types and the example dataset
Week 3 – Lecture A
CFAES Bioinformatics Core, OSU
2025-09-05
Sequence file types
Overview
DNA and protein (amino acid) sequences and sequence annotations are mostly stored in plain-text formats. Some of the most common types, which you’ll work with in this course, are:
- FASTA
Simple sequence files, where each entry contains a header and a sequence.
Versatile: may contain a few short sequences, entire genome assemblies, proteomes, …
- FASTQ
The standard format for HTS reads — includes a quality score for each nucleotide.
- SAM/BAM (not further discussed today)
An alignment format for HTS reads. E.g. produced when you align reads to a genome.
- GTF/GFF
A (genome) annotation format: table with information such as coordinates of genes and exons.
FASTA files
FASTA files contain one or more DNA or amino acid sequences, with no limits on the number of sequences or the sequence lengths.
The following example FASTA file contains two entries:
>unique_sequence_ID Optional description
ATTCATTAAAGCAGTTTATTGGCTTAATGTACATCAGTGAAATCATAAATGCTAAAAA
>unique_sequence_ID2
ATTCATTAAAGCAGTTTATTGGCTTAATGTACATCAGTGAAATCATAAATGCTAAATG
Each entry contains a header and the sequence itself, where:
- Header lines start with a “
>” and provide identifying information for the sequence - The sequence is often spread across multiple lines (with a fixed line width like 50 characters)
FASTA files most commonly have a .fa or .fasta file extension. Also used are .fna and .faa, which make explicit that it contains nucleotide or amino acid sequences, respectively.
FASTQ files
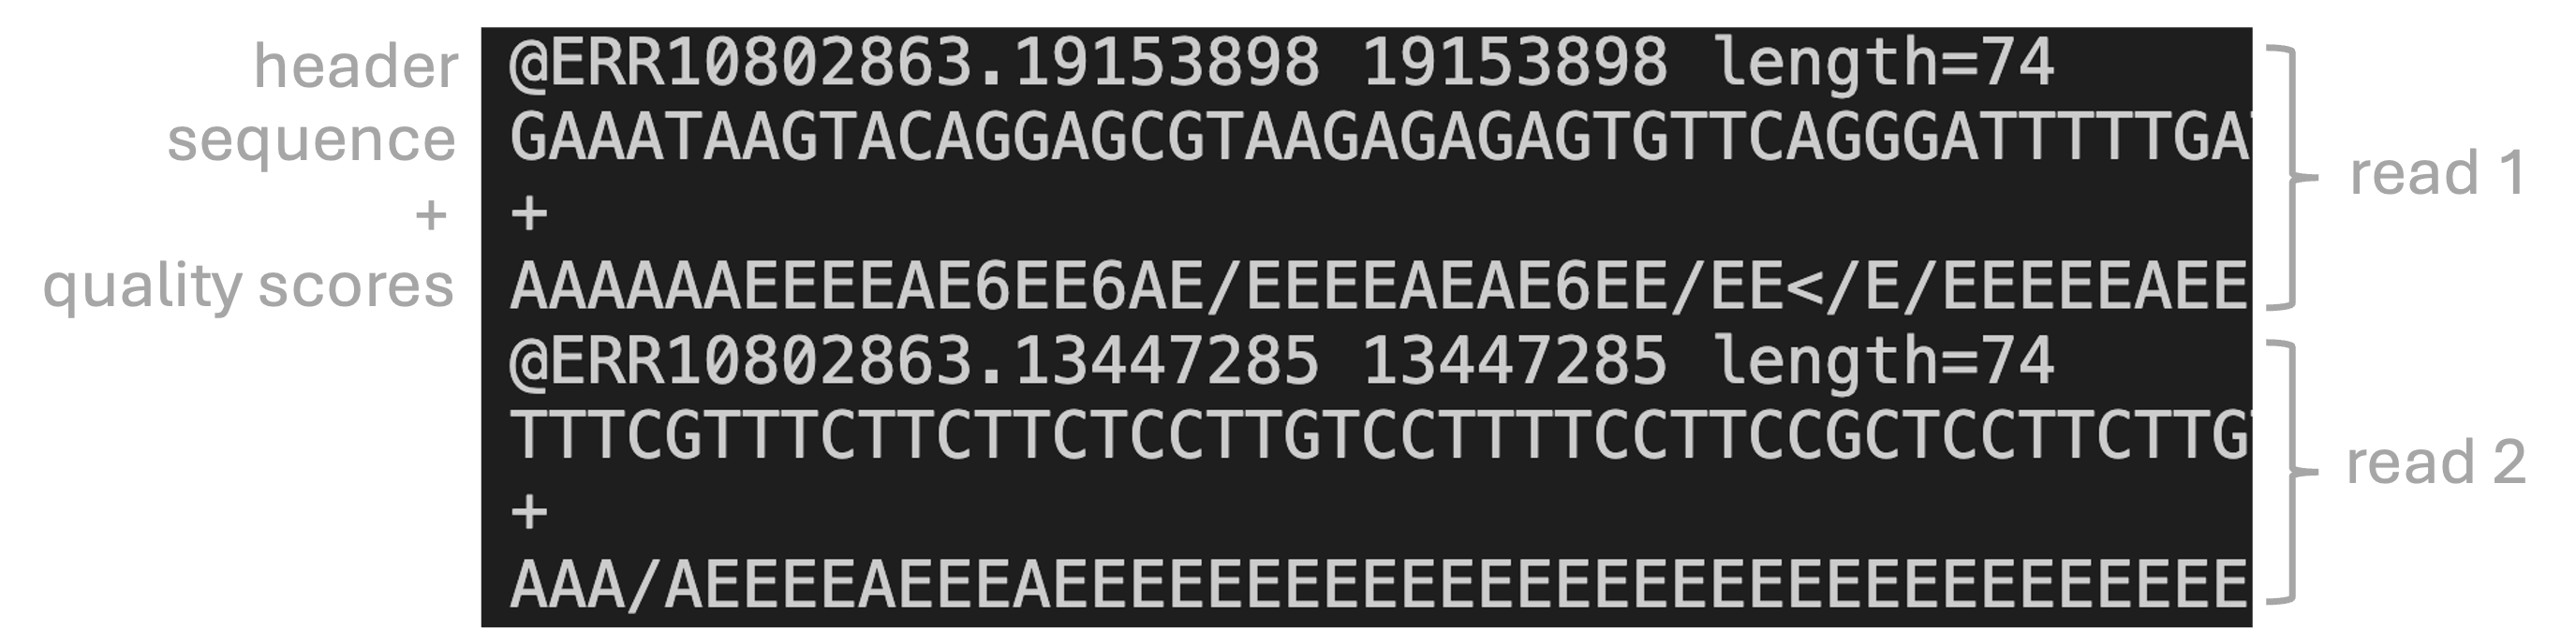
FASTQ is the standard format for HTS reads. Each read forms one FASTQ entry and is represented by four lines, which contain, respectively:
- A header that starts with
@and e.g. uniquely identifies the read - The sequence itself
- A plus sign,
+ - One-character quality scores for each base (hence FASTQ as in “Q” for “quality”)
FASTQ quality scores
The quality scores in the reads represent an estimate of the error probability of the base call.
Specifically, they correspond to a numeric “Phred” quality score (\(Q\)), which is a function of the estimated probability that a base call is erroneous (\(P\)):
\[ Q = -10 * log_{10}(P) \]
For example:
\[ 10 = -10 * log_{10}(0.1) \]
\[ 20 = -10 * log_{10}(0.01) \]
FASTQ quality scores
The quality scores in the reads represent an estimate of the error probability of the base call.
Specifically, they correspond to a numeric “Phred” quality score (\(Q\)), which is a function of the estimated probability that a base call is erroneous (\(P\)):
\[ Q = -10 * log_{10}(P) \]
Some specific probabilities and their rough qualitative interpretation for Illumina data:
| Phred quality score | Error probability | Rough interpretation |
|---|---|---|
| 10 | 1 in 10 | terrible |
| 20 | 1 in 100 | bad |
| 30 | 1 in 1,000 | good |
| 40 | 1 in 10,000 | excellent |
FASTQ quality scores (cont.)
To make things a little more complicated: the numeric Phred quality score is represented in FASTQ files by a “ASCII character” corresponding to the number rather than the number itself.
This allows for a single-character representation of each possible score — therefore, each quality score character can conveniently correspond to (& line up with) a base character in the read.
For example:
| Phred quality score | Error probability | ASCII character |
|---|---|---|
| 10 | 1 in 10 | + |
| 20 | 1 in 100 | 5 |
| 30 | 1 in 1,000 | ? |
| 40 | 1 in 10,000 | I |
FASTQ quality scores (cont.)
To make things a little more complicated: the numeric Phred quality score is represented in FASTQ files not by the number itself, but by a corresponding “ASCII character”.
This allows for a single-character representation of each possible score — therefore, each quality score character can conveniently correspond to (& line up with) a base character in the read.
FASTQ (cont.)
While FASTQ files can be any size, separate files are typically used for each:
Read direction for paired-end sequences
Read direction File name identifier Forward _R1Reverse _R2Sample
Reads are normally “demultiplexed” into separate files for each sample.
GTF/GFF files
The very similar GTF (.gtf) and GFF (.gff) formats are tabular annotation files with:
- One row for each annotated “genomic feature” (gene, exon, etc.)
- Columns with information like the genomic coordinates of the features
After a metadata header, the tabular part looks like this (column names added for clarity):
#seqname      source  feature     start   end     score  strand  frame    attributes
NC_068937.1   Gnomon  gene        2046    110808  .       +       .       gene_id "LOC120427725"; transcript_id ""; db_xref "GeneID:120427725"; description "homeotic protein deformed"; gbkey "Gene"; gene "LOC120427725"; gene_biotype "protein_coding";
NC_068937.1   Gnomon  transcript  2046    110808  .       +       .       gene_id "LOC120427725"; transcript_id "XM_052707445.1"; db_xref "GeneID:120427725"; gbkey "mRNA"; gene "LOC120427725"; model_evidence "Supporting evidence includes similarity to: 25 Proteins"; product "homeotic protein deformed, transcript variant X3"; transcript_biotype "mRNA";
NC_068937.1   Gnomon  exon        2046    2531    .       +       .       gene_id "LOC120427725"; transcript_id "XM_052707445.1"; db_xref "GeneID:120427725"; gene "LOC120427725"; model_evidence "Supporting evidence includes similarity to: 25 Proteins"; product "homeotic protein deformed, transcript variant X3"; transcript_biotype "mRNA"; exon_number "1";
NC_068937.1   Gnomon  exon        52113   52136   .       +       .       gene_id "LOC120427725"; transcript_id "XM_052707445.1"; db_xref "GeneID:120427725"; gene "LOC120427725"; model_evidence "Supporting evidence includes similarity to: 25 Proteins"; product "homeotic protein deformed, transcript variant X3"; transcript_biotype "mRNA"; exon_number "2";
Details for a few columns:
- seqname – Name of the chromosome, scaffold, or contig
- source — Name of the program that generated this feature, or the data source (e.g. database)
- attribute — A semicolon-separated list of tag-value pairs with additional information
The course’s main example dataset
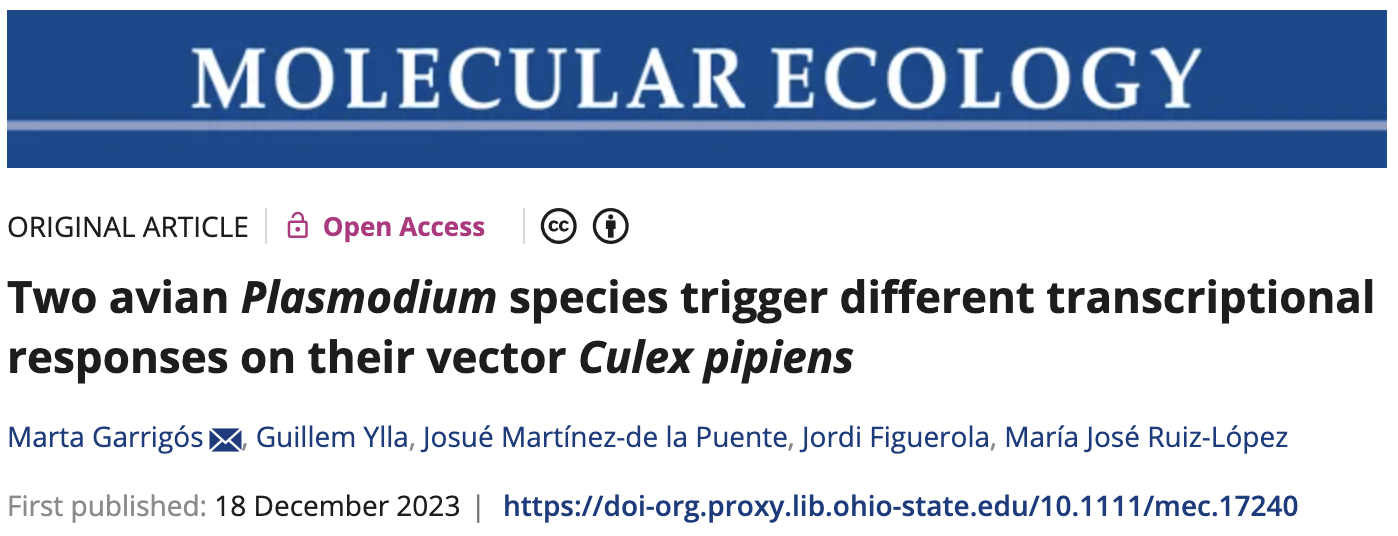
Garrigos et al. 2025
Throughout the course, we will use an example/practice data set from Garrigós et al. (2025):
Experimental design
This paper uses RNA-Seq data to study gene expression in Culex pipiens mosquitos infected with malaria-causing Plasmodium protozoans — specifically, it compares mosquitos according to:
- Infection status: control vs. Plasmodium cathemerium vs. P. relictum
- Time after infection: 1 vs. 10 vs. 21 days (DAI)
The following number of samples (biological replicates) were used for each treatment combination:
| Control | P. cathemerium | P. relictum | |
|---|---|---|---|
| 01 DAI | 3 | 3 | 4 |
| 10 DAI | 4 | 4 | 4 |
| 21 DAI | 4 | 4 | 3 |
The dataset’s files
To keep things manageable while practicing, I have subset the data to omit the 21-day samples and only keep 500,000 reads per FASTQ file.
All in all, the set of files, available through GitHub, consists of:
- Reads: 44 paired-end 75-bp Illumina FASTQ files for 22 samples
- A reference genome annotation GTF file for Culex pipiens (we will download the assembly FASTA file separately)
- Metadata (sample data): A table with e.g. treatment info for each sample
- A README file describing the data set
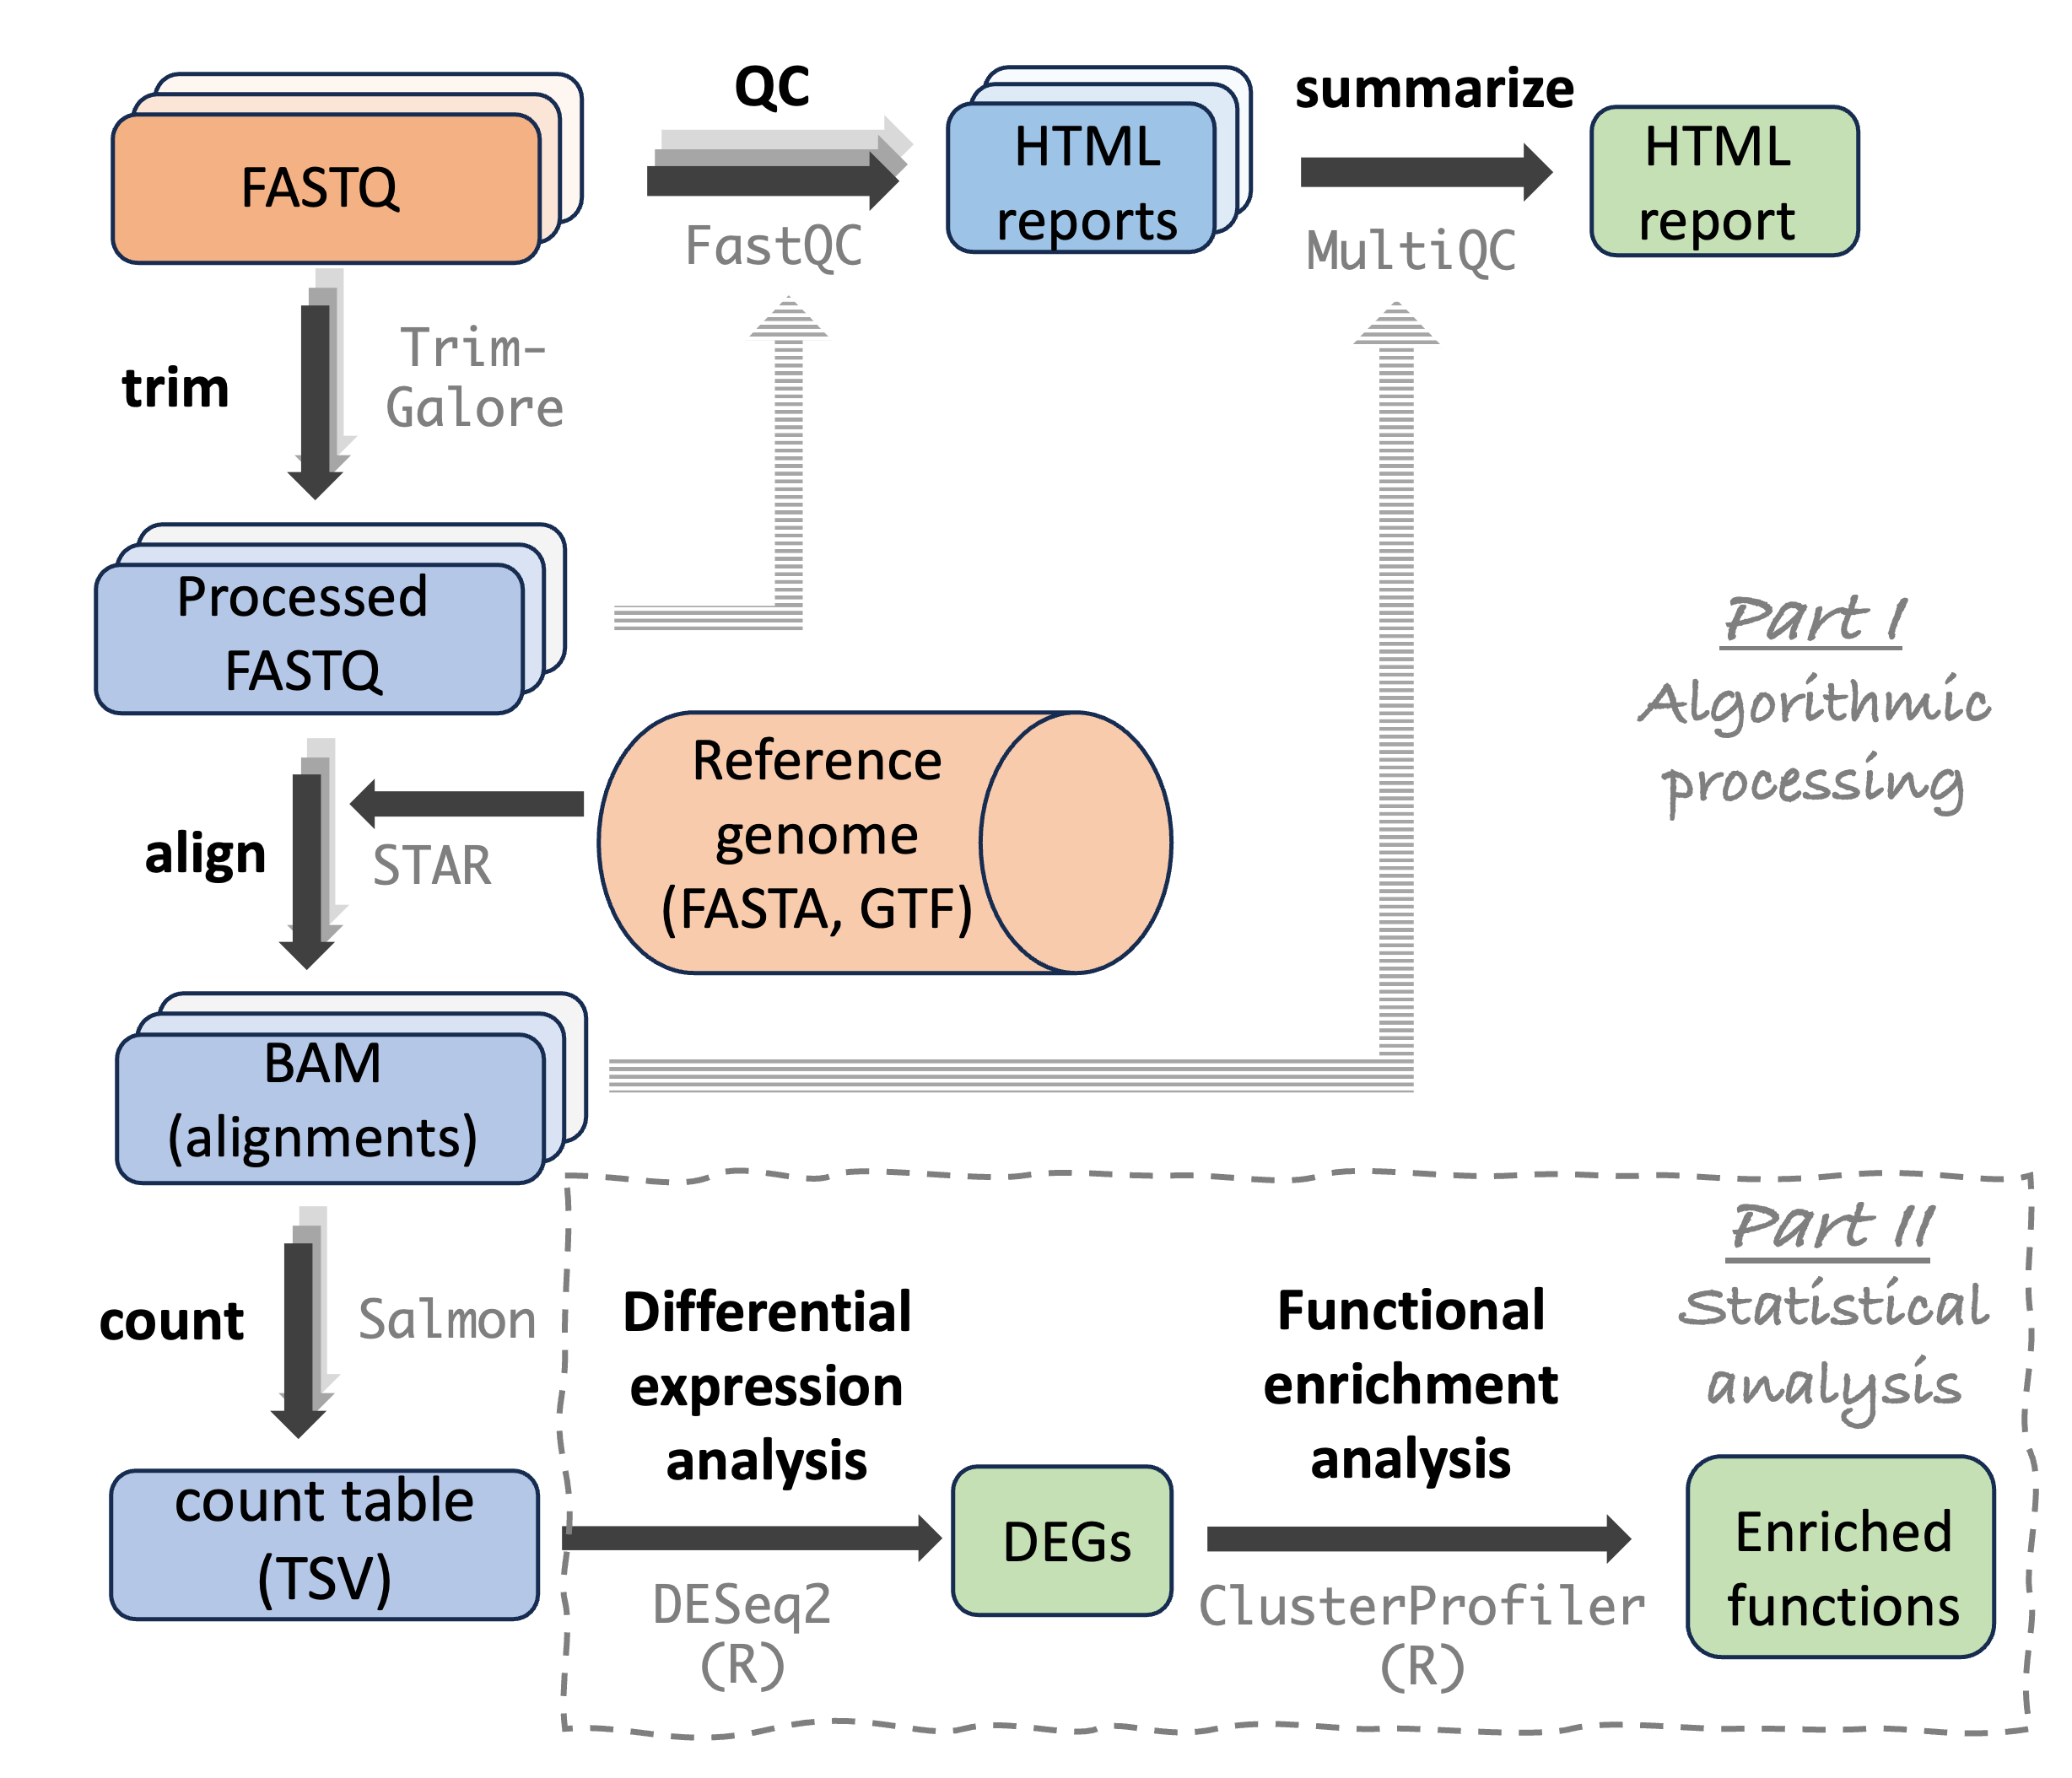
RNA-Seq analysis steps
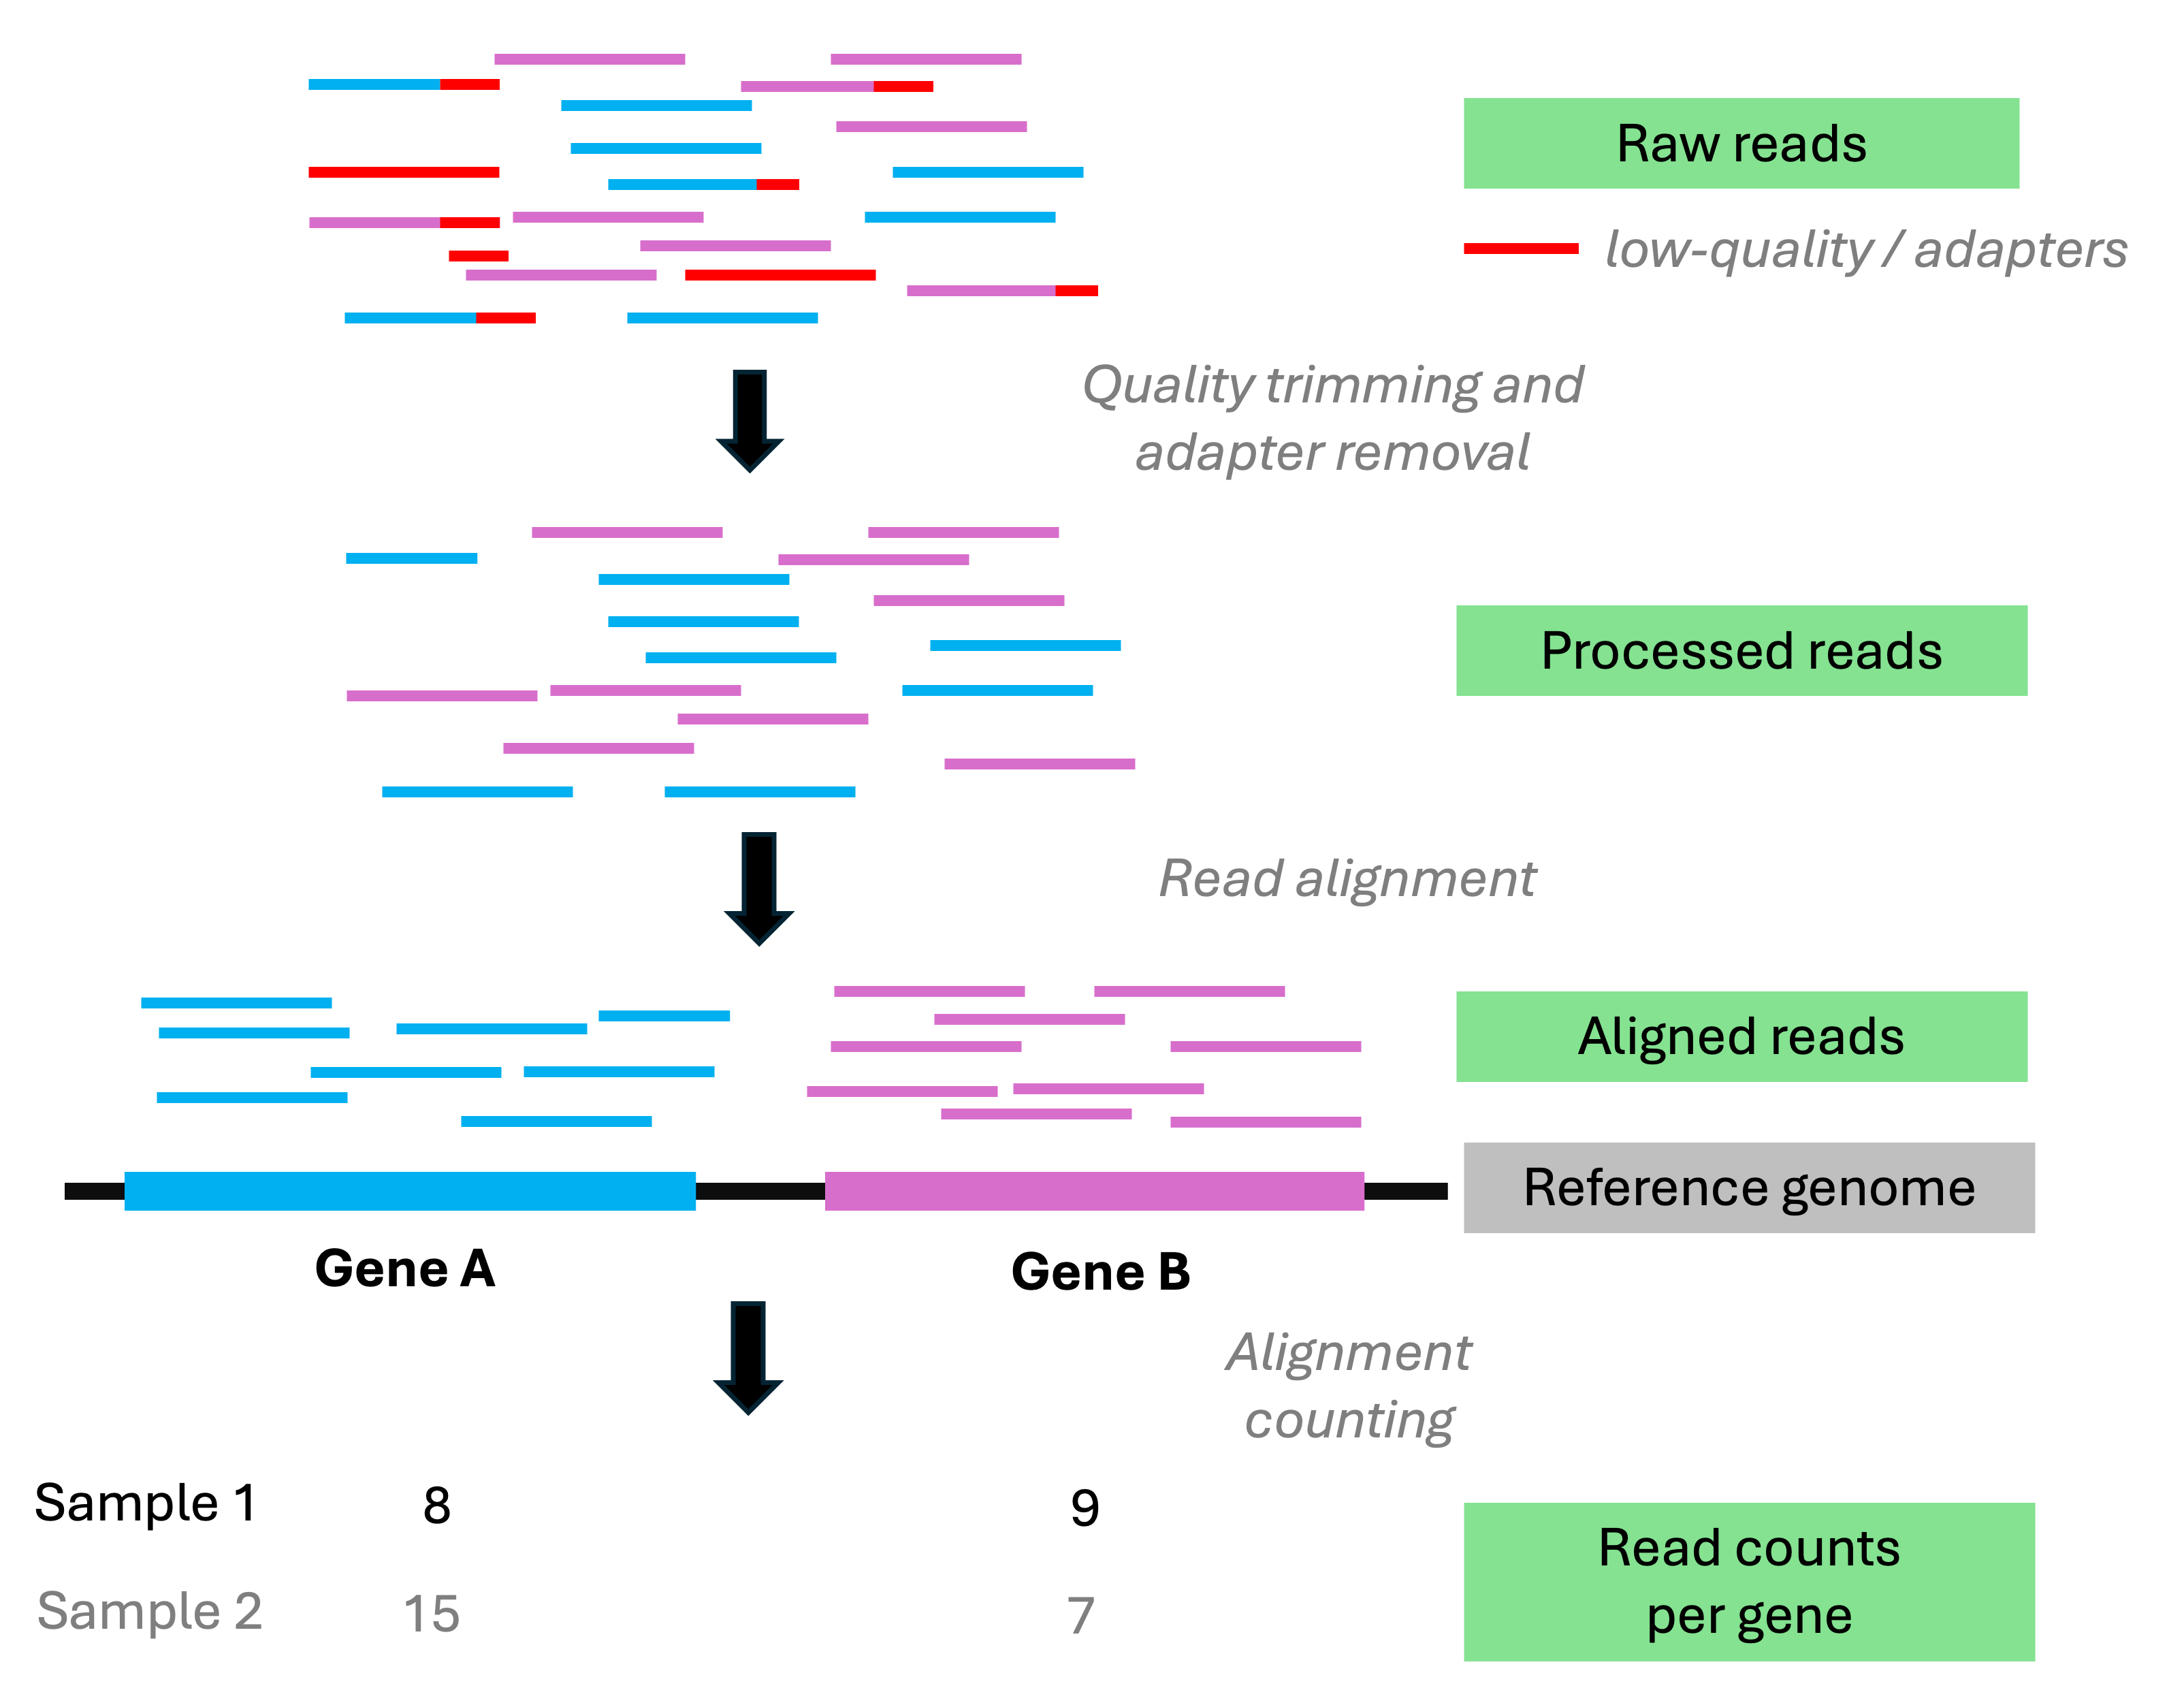
RNA-Seq analysis steps (cont.)
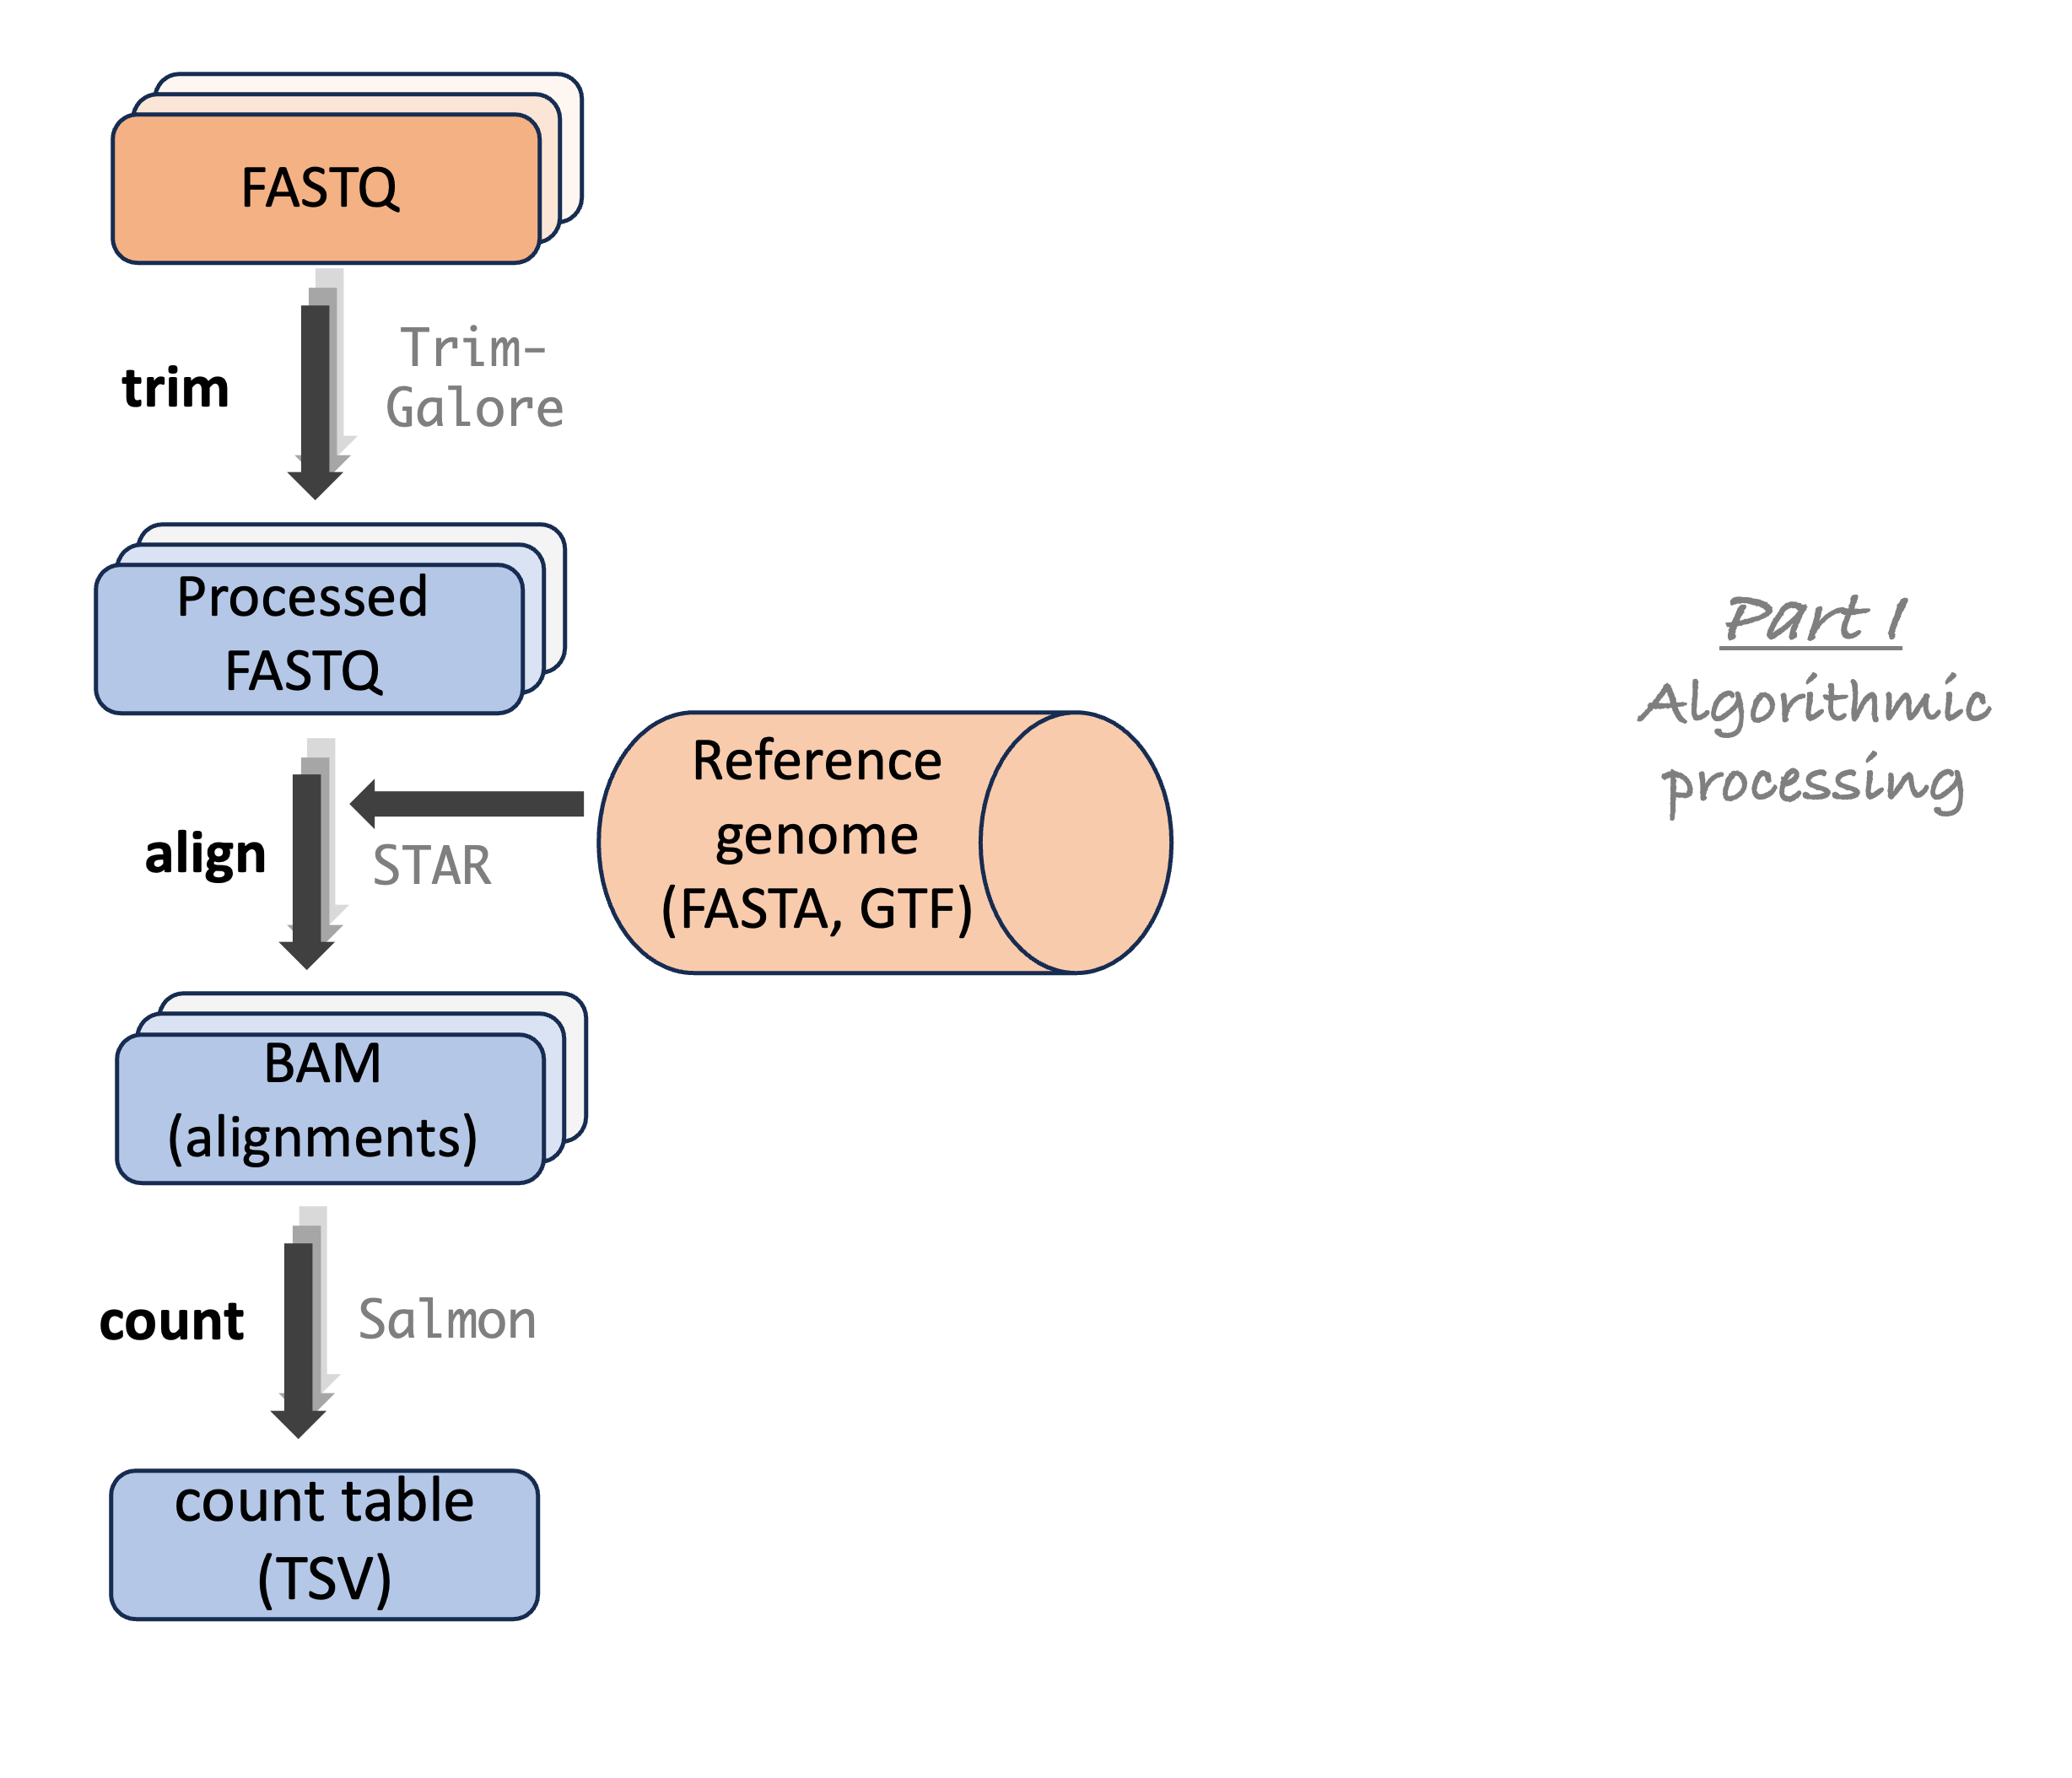
RNA-Seq analysis steps (cont.)
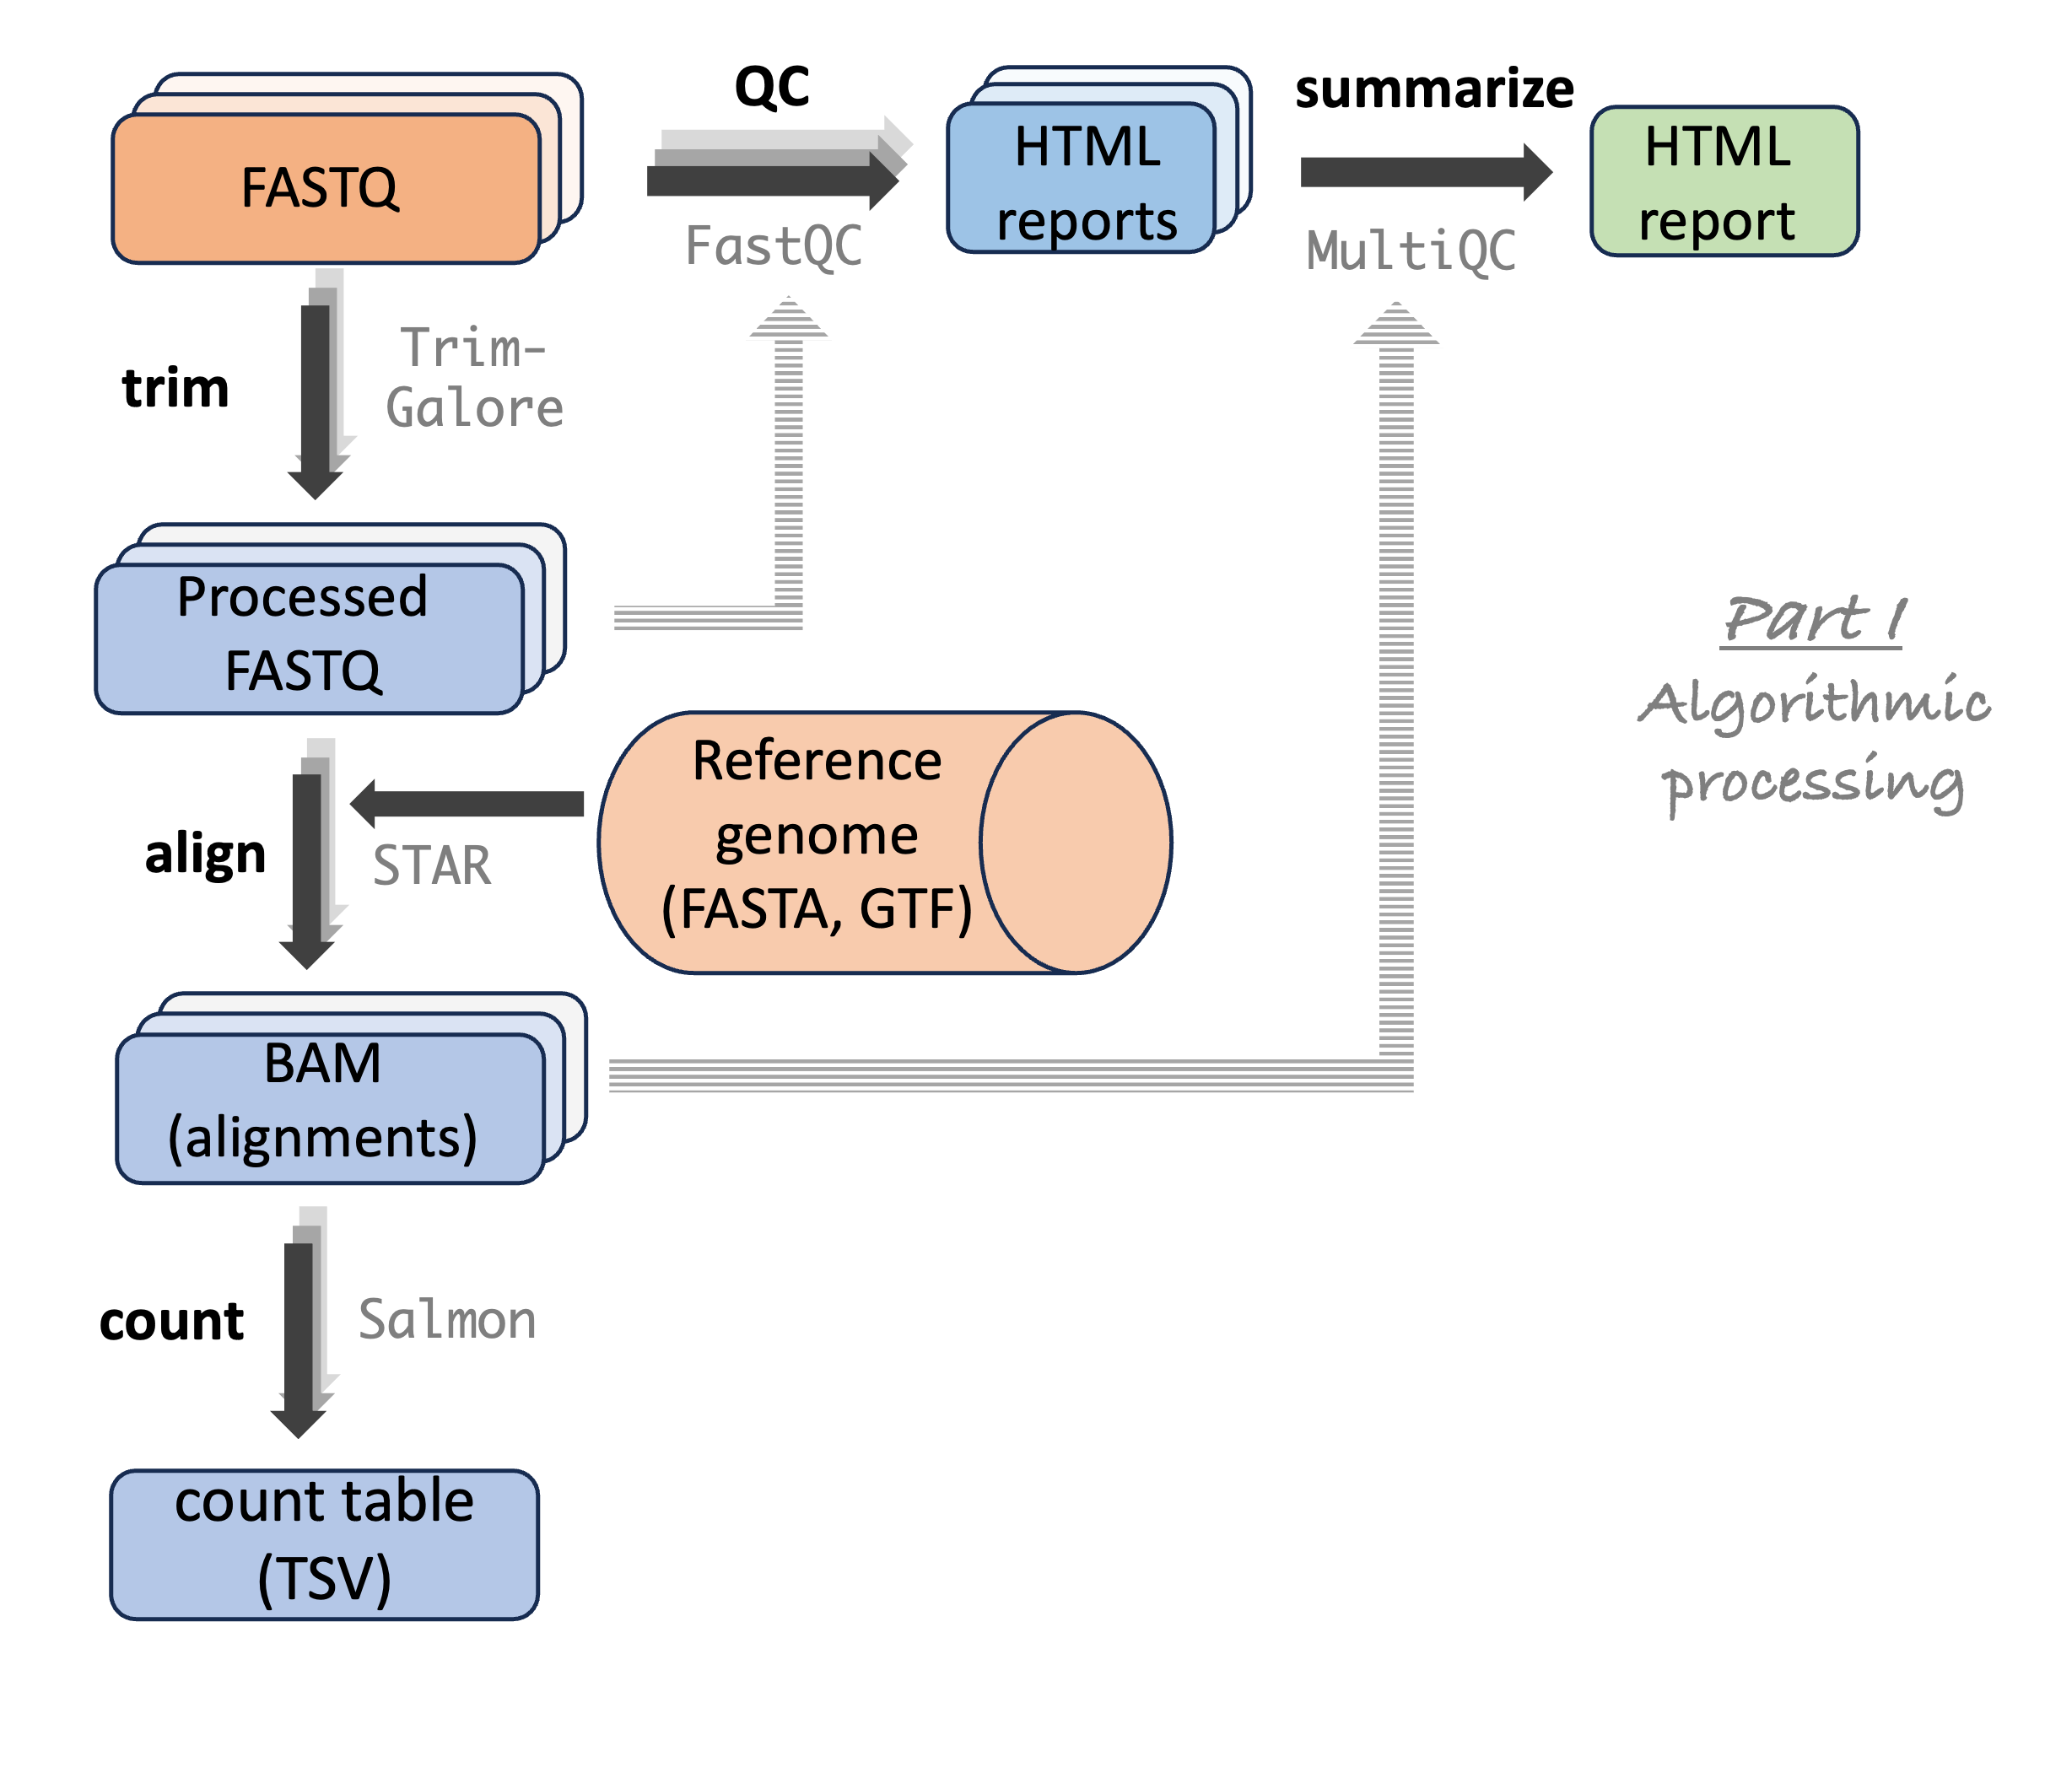
RNA-Seq analysis steps (cont.)